Neighbourhods that have seen sharp Covid rises as cases continue to spread rapidly across the Warwick district
and live on Freeview channel 276
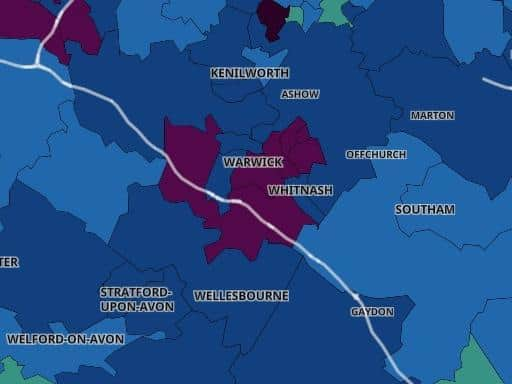
The recent spike in Covid cases has continued across the Warwick district, according to the latest figures.
As we reported last week, Leamington is currently experiencing a significant rise in positive cases - health experts believe this is mainly due to a rise in cases among students at the University of Warwick.
Advertisement
Hide AdAdvertisement
Hide AdClick here to read more - Message from council leader as Leamington's Covid rate is now among of the highest in the countryBut now the new figures show that cases are rapidly increasing in Warwick. There have been much smaller rises in Kenilworth.

However, hospitals have still not seen a significant increase in patients and the cases are still mainly among the younger age groups who have not yet had a vaccine.
The latest figures cover the seven-day period up to June 30. According to these numbers, the Leamington Brunswick ward still has the highest rate of infections but there has been a slight drop in cases. The area has seen 68 new cases over the seven days, a 27 per cent reduction compared to the previous seven days. But that still means it has an infection rate of 621.7 cases per 100,000 people, which is one of the highest in the Midlands.
Overall, the Warwick district has a rate of 438.3 cases per 100,000.
Advertisement
Hide AdAdvertisement
Hide AdAll the other areas in Leamington and Warwick have seen increases. Here is a breakdown of the figures in Leamington, Warwick and Kenilworth:
Leamington Brunswick
Total cases: 68
The rate has decreased relative to the previous week by 25 (-26.9%)
Case rate per 100,000 people: 621.7
Leamington East and Sydenham
Total cases: 67
The rate has increased relative to the previous week by 23 (52.3%)
Case rate per 100,000 people: 604.7
Lillington
Total cases: 24
The rate has increased relative to the previous week by 11 (84.6%)
Case rate per 100,000 people: 438.0
Leamington Central and North
Total cases: 84
Advertisement
Hide AdAdvertisement
Hide AdThe rate has increased relative to the previous week by 32 (61.5%)
Case rate per 100,000 people: 614.1
Leamington West and Milverton
Total cases: 55
The rate has increased relative to the previous week by 33 (150.0%)
Case rate per 100,000 people: 569.9
Whitnash
Total cases: 36
The rate has increased relative to the previous week by 23 (176.9%)
Case rate per 100,000 people: 366.8
Warwick South East, Myton and Heathcote
Total cases: 67
The rate has increased relative to the previous week by 46 (219.0%)
Case rate per 100,000 people: 576.1
Warwick South West and Aylesford
Total cases: 43
Advertisement
Hide AdAdvertisement
Hide AdThe rate has increased relative to the previous week by 33 (330.0%)
Case rate per 100,000 people: 341.7
Warwick North
Total cases: 33
The rate has increased relative to the previous week by 17 (106.2%)
Case rate per 100,000 people: 392.5
Bishops Tachbrook, Barford and Hatton Park
Total cases: 56
The rate has increased relative to the previous week by 37 (194.7%)
Case rate per 100,000 people: 576.7
Kenilworth West
Total cases: 22
The rate has increased relative to the previous week by 18 (450.0%)
Case rate per 100,000 people: 295.3
Kenilworth South
Total cases: 17
Advertisement
Hide AdAdvertisement
Hide AdThe rate has increased relative to the previous week by 13 (325.0%)
Case rate per 100,000 people: 238.1
Kenilworth East
Total cases: 14
The rate has increased relative to the previous week by 4 (40.0%)
Case rate per 100,000 people: 174.4